Area Overview for E14 3EU
Photos of E14 3EU

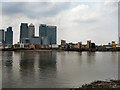
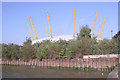
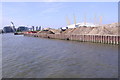
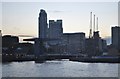
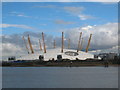
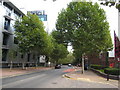
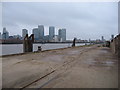
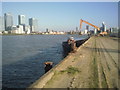
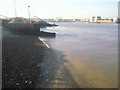
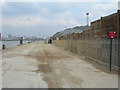
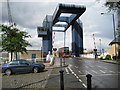
100 photos from this area
Area Information
Key information about the E14 3EU including its size, population, and administrative classification.
- Area Type
- Postcode
- Area Size
- 1.9 hectares
- Population
- 1976
- Population Density
- 14835 people/km²
House Prices in E14 3EU
52
Properties
£401,690
Average Sold Price
£99,950
Lowest Price
£807,500
Highest Price
Showing 52 properties
| Address | Type | Beds | Baths | Last Sale Price | Last Sale Date | |
|---|---|---|---|---|---|---|
| 34 Capstan Square, London, E14 3EU | Terraced | 3 | 1 | £555,000 | May 2023 | |
| 44 Capstan Square, London, E14 3EU | house | 5 | 5 | £600,000 | Sep 2022 | |
| 50 Capstan Square, London, E14 3EU | Semi-detached | 4 | 1 | £615,000 | May 2022 | |
| 10 Capstan Square, London, E14 3EU | house | - | - | £555,000 | Dec 2021 | |
| 5 Capstan Square, London, E14 3EU | Detached | 4 | 2 | £610,000 | Mar 2021 | |
| 7 Capstan Square, London, E14 3EU | Terraced | 3 | 2 | £560,000 | Oct 2020 | |
| 18 Capstan Square, London, E14 3EU | house | - | - | £807,500 | Mar 2020 | |
| 25 Capstan Square, London, E14 3EU | house | 3 | - | £730,000 | Aug 2019 | |
| 33 Capstan Square, London, E14 3EU | house | 4 | 3 | £710,000 | Mar 2019 | |
| 8 Capstan Square, London, E14 3EU | Terraced | 3 | 1 | £500,000 | Feb 2019 |
Page 1 of 6
Energy Efficiency in E14 3EU
Amenities
Schools
| Rank | School | Type | Entry gender | Ages |
|---|
Explore more schools in this area
Go to Schools tabDemographics
Household Size
One person
most common
Accommodation Type
Flats
most common
Tenure
26
majority
Ethnic Group
White
most common
Religion
N/A
most common
Household Composition
N/A
most common
Age
47
median
Adults (30-64 years)
most common
Household Deprivation
N/A
with no deprivation
NS-SEC
44
in Lower managerial occupations
Explore more demographic insights in this area
Go to Demographics tabPlanning
Planning Constraints
- Flood RiskPremium
- Ramsar Wetland SitesPremium
- Area of Outstanding Natural BeautyPremium
- Protected Nature ReservePremium
- Protected WoodlandPremium