Area Overview for E13 9NG
Photos of E13 9NG

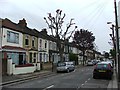
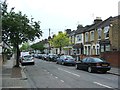
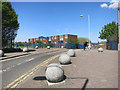

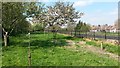
55 photos from this area
Area Information
Key information about the E13 9NG including its size, population, and administrative classification.
- Area Type
- Postcode
- Area Size
- 7043 m²
- Population
- Not available
- Population Density
- Not available
House Prices in E13 9NG
53
Properties
£208,804
Average Sold Price
£46,000
Lowest Price
£450,000
Highest Price
Showing 53 properties
| Address | Type | Beds | Baths | Last Sale Price | Last Sale Date | |
|---|---|---|---|---|---|---|
| 144 Tunmarsh Lane, Plaistow, London, E13 9NG | Terraced | 1 | 1 | £450,000 | Dec 2022 | |
| 180 Tunmarsh Lane, Plaistow, London, E13 9NG | Terraced | 4 | 2 | £360,000 | Dec 2022 | |
| 146 Tunmarsh Lane, Plaistow, London, E13 9NG | house | 1 | - | £310,000 | Jan 2022 | |
| 126 Tunmarsh Lane, Plaistow, London, E13 9NG | house | - | - | £380,000 | Oct 2021 | |
| 120 Tunmarsh Lane, Plaistow, London, E13 9NG | Terraced | 3 | 1 | £374,000 | Nov 2018 | |
| 142 Tunmarsh Lane, Plaistow, London, E13 9NG | Terraced | 3 | - | £420,000 | Nov 2017 | |
| 110 Tunmarsh Lane, Plaistow, London, E13 9NG | Terraced | 3 | 2 | £308,000 | Mar 2016 | |
| 158 Tunmarsh Lane, Plaistow, London, E13 9NG | house | - | - | £249,999 | Sep 2014 | |
| 118 Tunmarsh Lane, Plaistow, London, E13 9NG | house | 2 | 1 | £200,000 | Jun 2014 | |
| 104 Tunmarsh Lane, Plaistow, London, E13 9NG | Terraced | 3 | 1 | £270,000 | Jun 2014 |
Page 1 of 6
Energy Efficiency in E13 9NG
Amenities
Schools
| Rank | School | Type | Entry gender | Ages |
|---|
Explore more schools in this area
Go to Schools tabDemographics
Household Size
Family (3-5 people)
most common
Accommodation Type
Houses
most common
Tenure
50
majority
Ethnic Group
asian_total
most common
Religion
N/A
most common
Household Composition
N/A
most common
Age
47
median
Adults (30-64 years)
most common
Household Deprivation
N/A
with no deprivation
NS-SEC
25
in Lower managerial occupations
Explore more demographic insights in this area
Go to Demographics tabPlanning
Planning Constraints
- Flood RiskPremium
- Ramsar Wetland SitesPremium
- Area of Outstanding Natural BeautyPremium
- Protected Nature ReservePremium
- Protected WoodlandPremium