Area Overview for E13 8NT
Photos of E13 8NT
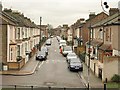
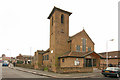

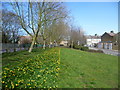
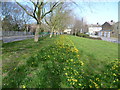
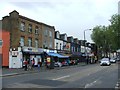
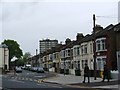
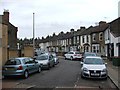
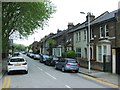
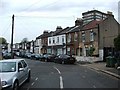
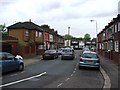
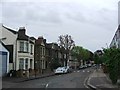
80 photos from this area
Area Information
Key information about the E13 8NT including its size, population, and administrative classification.
- Area Type
- Postcode
- Area Size
- 8358 m²
- Population
- 2201
- Population Density
- 6225 people/km²
House Prices in E13 8NT
40
Properties
£202,662
Average Sold Price
£46,600
Lowest Price
£410,000
Highest Price
Showing 40 properties
| Address | Type | Beds | Baths | Last Sale Price | Last Sale Date | |
|---|---|---|---|---|---|---|
| 56 Palmer Road, Plaistow, London, E13 8NT | house | - | - | £410,000 | Jun 2024 | |
| 24 Palmer Road, Plaistow, London, E13 8NT | Terraced | 2 | 1 | £405,000 | Feb 2021 | |
| 32 Palmer Road, Plaistow, London, E13 8NT | Terraced | 3 | 1 | £360,500 | Sep 2018 | |
| 28 Palmer Road, Plaistow, London, E13 8NT | house | - | - | £205,000 | Oct 2010 | |
| 58 Palmer Road, Plaistow, London, E13 8NT | Terraced | - | - | £220,000 | Aug 2009 | |
| 70 Palmer Road, Plaistow, London, E13 8NT | house | - | - | £185,000 | May 2008 | |
| 14 Palmer Road, Plaistow, London, E13 8NT | Terraced | - | - | £140,000 | Sep 2005 | |
| 40 Palmer Road, Plaistow, London, E13 8NT | house | 1 | 1 | £175,000 | Oct 2004 | |
| 10 Palmer Road, Plaistow, London, E13 8NT | house | 3 | - | £165,000 | May 2004 | |
| 52 Palmer Road, Plaistow, London, E13 8NT | Semi-detached | 5 | 1 | £132,500 | May 2002 |
Page 1 of 4
Energy Efficiency in E13 8NT
Amenities
Schools
| Rank | School | Type | Entry gender | Ages |
|---|
Explore more schools in this area
Go to Schools tabDemographics
Household Size
Family (3-5 people)
most common
Accommodation Type
Houses
most common
Tenure
37
majority
Ethnic Group
White
most common
Religion
N/A
most common
Household Composition
N/A
most common
Age
47
median
Adults (30-64 years)
most common
Household Deprivation
N/A
with no deprivation
NS-SEC
19
in Lower managerial occupations
Explore more demographic insights in this area
Go to Demographics tabPlanning
Planning Constraints
- Flood RiskPremium
- Ramsar Wetland SitesPremium
- Area of Outstanding Natural BeautyPremium
- Protected Nature ReservePremium
- Protected WoodlandPremium