Area Overview for E13 0PE
Photos of E13 0PE
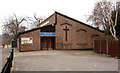
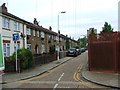
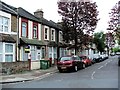
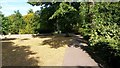
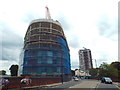
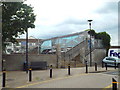
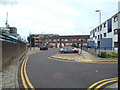
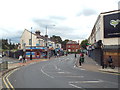
70 photos from this area
Area Information
Key information about the E13 0PE including its size, population, and administrative classification.
- Area Type
- Postcode
- Area Size
- 1.6 hectares
- Population
- 1888
- Population Density
- 12914 people/km²
House Prices in E13 0PE
89
Properties
£357,097
Average Sold Price
£82,000
Lowest Price
£600,000
Highest Price
Showing 89 properties
| Address | Type | Beds | Baths | Last Sale Price | Last Sale Date | |
|---|---|---|---|---|---|---|
| 23 Queens Road West, Plaistow, London, E13 0PE | house | 3 | - | £600,000 | Jul 2022 | |
| 49 Queens Road West, Plaistow, London, E13 0PE | house | 3 | 1 | £353,500 | Jan 2019 | |
| 21 Queens Road West, Plaistow, London, E13 0PE | Semi-detached | 4 | 2 | £540,000 | Nov 2018 | |
| 39 Queens Road West, Plaistow, London, E13 0PE | Terraced | 3 | 2 | £370,000 | Sep 2018 | |
| 13 Queens Road West, Plaistow, London, E13 0PE | Terraced | 4 | 2 | £530,000 | Feb 2018 | |
| 15 Queens Road West, Plaistow, London, E13 0PE | Terraced | 3 | 1 | £440,000 | Apr 2015 | |
| 17 Queens Road West, Plaistow, London, E13 0PE | house | 3 | - | £440,000 | Feb 2015 | |
| 19 Queens Road West, Plaistow, London, E13 0PE | house | 3 | - | £425,000 | Feb 2015 | |
| 25 Queens Road West, Plaistow, London, E13 0PE | house | 3 | - | £449,950 | Dec 2014 | |
| 27 Queens Road West, Plaistow, London, E13 0PE | Semi-detached | 3 | 1 | £331,000 | Nov 2014 |
Page 1 of 9
Energy Efficiency in E13 0PE
Amenities
Schools
| Rank | School | Type | Entry gender | Ages |
|---|
Explore more schools in this area
Go to Schools tabDemographics
Household Size
Family (3-5 people)
most common
Accommodation Type
Houses
most common
Tenure
37
majority
Ethnic Group
asian_total
most common
Religion
N/A
most common
Household Composition
N/A
most common
Age
47
median
Adults (30-64 years)
most common
Household Deprivation
N/A
with no deprivation
NS-SEC
23
in Lower managerial occupations
Explore more demographic insights in this area
Go to Demographics tabPlanning
Planning Constraints
- Flood RiskPremium
- Ramsar Wetland SitesPremium
- Area of Outstanding Natural BeautyPremium
- Protected Nature ReservePremium
- Protected WoodlandPremium