Area Overview for E12 6LW
Photos of E12 6LW
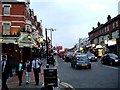


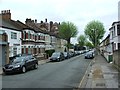


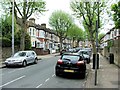
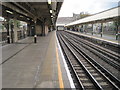
79 photos from this area
Area Information
Key information about the E12 6LW including its size, population, and administrative classification.
- Area Type
- Postcode
- Area Size
- 1.2 hectares
- Population
- 1893
- Population Density
- 15700 people/km²
House Prices in E12 6LW
38
Properties
£204,337
Average Sold Price
£53,000
Lowest Price
£499,000
Highest Price
Showing 38 properties
| Address | Type | Beds | Baths | Last Sale Price | Last Sale Date | |
|---|---|---|---|---|---|---|
| 109 Shakespeare Crescent, Manor Park, London, E12 6LW | Semi-detached | 3 | 2 | £499,000 | Nov 2020 | |
| 115 Shakespeare Crescent, Manor Park, London, E12 6LW | Terraced | 3 | 1 | £424,500 | Jan 2019 | |
| 95 Shakespeare Crescent, Manor Park, London, E12 6LW | Terraced | 3 | 2 | £249,950 | Apr 2014 | |
| 107 Shakespeare Crescent, Manor Park, London, E12 6LW | Semi-detached | 5 | 2 | £220,000 | Oct 2013 | |
| 131 Shakespeare Crescent, Manor Park, London, E12 6LW | Flat | - | - | £85,000 | Jan 2013 | |
| 137 Shakespeare Crescent, Manor Park, London, E12 6LW | house | 3 | - | £249,000 | Aug 2010 | |
| 145 Shakespeare Crescent, Manor Park, London, E12 6LW | house | - | - | £214,000 | Apr 2009 | |
| 125 Shakespeare Crescent, Manor Park, London, E12 6LW | Terraced | - | - | £230,000 | Mar 2009 | |
| 163 Shakespeare Crescent, Manor Park, London, E12 6LW | house | - | - | £245,000 | Dec 2008 | |
| 139 Shakespeare Crescent, Manor Park, London, E12 6LW | Terraced | - | - | £238,000 | Aug 2008 |
Page 1 of 4
Energy Efficiency in E12 6LW
Amenities
Schools
| Rank | School | Type | Entry gender | Ages |
|---|
Explore more schools in this area
Go to Schools tabDemographics
Household Size
Family (3-5 people)
most common
Accommodation Type
Houses
most common
Tenure
53
majority
Ethnic Group
asian_total
most common
Religion
N/A
most common
Household Composition
N/A
most common
Age
47
median
Adults (30-64 years)
most common
Household Deprivation
N/A
with no deprivation
NS-SEC
20
in Lower managerial occupations
Explore more demographic insights in this area
Go to Demographics tabPlanning
Planning Constraints
- Flood RiskPremium
- Ramsar Wetland SitesPremium
- Area of Outstanding Natural BeautyPremium
- Protected Nature ReservePremium
- Protected WoodlandPremium