Area Overview for Crystal Palace & Anerley Ward
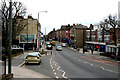
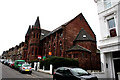
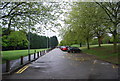
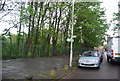
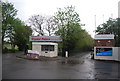
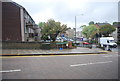
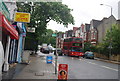
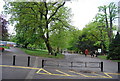
Photos of Crystal Palace & Anerley Ward
Area Information
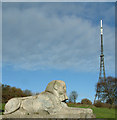
Living in Crystal Palace & Anerley Ward offers a residential experience centred around the historic Norwood Ridge. This small electoral ward within the London Borough of Bromley covers an area size of 2.0 km², making it one of the more compact neighbourhoods to consider. The ward encompasses areas historically linked to Penge and Sydenham Hill, including the site of the former Crystal Palace exhibition building. You will find yourself situated near the Penge Place estate, which reflects the area's significant 19th-century heritage. The vicinity includes the National Sports Centre, featuring an athletics track and stadium, providing local athletic facilities for residents. The heart of the community revolves around Anerley Town Hall, a building constructed in 1878 that now functions as a business centre and community hub. The Crystal Palace Community Trust manages this location, fostering local engagement since 2004. Adjacent to the park sits the Crystal Palace Museum on Anerley Hill, dedicated to preserving the history of the great glass building. You are living in a zone where the south tower base remains a listed historic feature near the museum. The ward's population of 1308 residents creates a tightly knit environment within this specific geographical boundary. Daily life here is defined by proximity to these unique leisure and historical landmarks, distinct from the broader suburban sprawl of South London.
- Area Type
- District Borough Unitary Ward
- Area Size
- 2.0 km²
- Population
- 1308
- Population Density
- 646 people/km²
Demographics
The community profile of Crystal Palace & Anerley Ward shows a population with a median age of 70, indicating an area dominated by retirees and older residents. This age demographic shapes the local demand for housing and services, focusing on needs typical of later life stages. With a total population count of 1308 across 2.0 km², the density reaches 646 people per square kilometre. Home ownership stands at 39%, suggesting that a significant portion of households reside in rental properties rather than owning their homes outright. The data indicates the ward does not currently have specific breakdowns for predominant ethnic groups or religious affiliations available in the provided figures. Accommodation types and detailed household composition details are listed as totals, meaning you must look beyond the raw percentages to understand the internal makeup of the homes. The absence of specific demographic splits means the visual character of the estates is driven by this older age profile. A median age of 70 implies a quieter atmosphere compared to younger urban districts, with residents likely prioritising peace and low-maintenance living. The 39% ownership rate is a concrete metric that buyers can use to gauge market fluidity and investment potential. It suggests a mixed market where both landlords and current homeowners shape the local property landscape. This demographic reality means the local amenities cater significantly to an older generation, influencing everything from local shop offerings to community events.
Household Size
Accommodation Type
Tenure
Ethnic Group
Religion
Household Composition
Age
Household Deprivation
NS-SEC
Explore more demographic insights in this area
Go to Demographics tabPlanning
Planning Constraints
- Flood RiskPremium
- Ramsar Wetland SitesPremium
- Area of Outstanding Natural BeautyPremium
- Protected Nature ReservePremium
- Protected WoodlandPremium
- Crime RiskPremium