Area Overview for Stanford-le-Hope
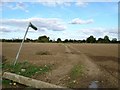
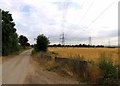
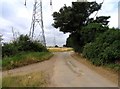
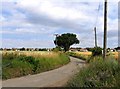
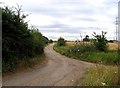
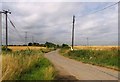
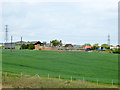
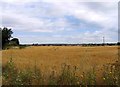
Photos of Stanford-le-Hope


Area Information
Stanford-le-Hope is a compact built-up area in England, covering 9.2 km² with a population of 5,645. Its population density of 613 people per square kilometre reflects a tight-knit community, where daily life is shaped by proximity to local amenities and transport links. The area’s character is defined by its modest scale and practical infrastructure, offering a quieter alternative to larger towns. Residents benefit from nearby rail services, including Stanford and Basildon stations, and a ferry terminal at Tilbury, which connects to surrounding regions. The median age of 70 suggests a community skewed towards older residents, though this does not preclude younger families. For those considering living in Stanford-le-Hope, the blend of accessible transport, low crime risk, and a range of local schools makes it a viable option for those prioritising safety and convenience over urban vibrancy.
- Area Type
- Built Up Area 250
- Area Size
- 9.2 km²
- Population
- 5645
- Population Density
- 613 people/km²
Living in Stanford-le-Hope offers access to essential amenities within practical reach. Retail options include five local stores, such as Budgens Corringham and Iceland Corringham, providing everyday shopping convenience. The area’s rail stations connect to nearby towns, while the Tilbury Ferry Terminal offers transport to surrounding regions. Though parks or leisure facilities are not explicitly named in the data, the presence of multiple retail and transport points suggests a functional lifestyle. The compact nature of the area means residents can access necessities without long commutes. The mix of shops, rail, and ferry services creates a practical environment for daily living, though those seeking extensive leisure options may need to travel further. The community’s focus on accessibility and connectivity makes it suitable for those prioritising convenience over expansive recreational spaces.
Amenities
Schools
Stanford-le-Hope is served by five primary schools, including Abbots Hall Primary School, Graham James Primary School, Corringham Primary School, Arthur Bugler Primary School, and Arthur Bugler Junior School. These institutions cater to younger children, providing a range of options for families with primary-aged children. The concentration of primary schools within the area suggests a focus on early education, though no secondary schools are listed. The presence of multiple primary schools may reduce travel times for families, allowing children to attend nearby institutions. However, the absence of secondary school data means parents should verify if local secondary education options are accessible. The mix of school names indicates a variety of educational providers, though without Ofsted ratings, it is not possible to assess their performance. For families prioritising proximity to schools, the availability of five primary options is a practical advantage.
| Rank | School | Type | Entry gender | Ages |
|---|
Explore more schools in this area
Go to Schools tabDemographics
Stanford-le-Hope’s population includes a median age of 70, indicating a predominantly older demographic. The most common age range is not specified, but the overall age profile suggests a community with a higher proportion of retirees. Home ownership is high at 77%, reflecting a stable housing market where most residents live in properties they own. Accommodation types are not detailed, but the data implies a mix of housing stock. The area’s predominant ethnic group and religious composition are not quantified, though the absence of specific figures means diversity metrics are not available. The population density of 613 people per km² means residents live in a relatively close-knit environment, which can foster community ties but may limit space for larger families. The age profile and ownership rates suggest a settlement where older residents are the primary demographic, with fewer young households.
Household Size
Accommodation Type
Tenure
Ethnic Group
Religion
Household Composition
Age
Household Deprivation
NS-SEC
Explore more demographic insights in this area
Go to Demographics tabPlanning
Planning Constraints
- Crime RiskPremium