Area Overview for Southtown and Cobholm Ward
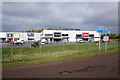
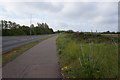
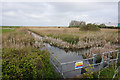
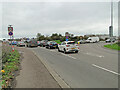
Photos of Southtown and Cobholm Ward


Area Information
Southtown and Cobholm Ward occupies just 3.1 km² of land within England, making it a compact district borough unitary ward. Despite its small physical footprint, the area accommodates 1,519 residents, creating a density of 491 people per square kilometre. This concentration shapes daily life, where neighbours are few in total number but likely close in proximity. Living in Southtown and Cobholm Ward means experiencing a tightly packed community where space is at a premium. The ward stands out for its restrictive size relative to its population, meaning that local amenities and services must be accessed within walking distance or through very nearby routes. You will find that the area functions as a concentrated residential zone rather than a sprawling suburb. Prospective buyers seeking this specific ward need to recognise that the limited land area fundamentally dictates the character of the neighbourhood, limiting expansion and shaping the overall streetscape. Understanding this scale is essential when evaluating homes in Southtown and Cobholm Ward.
- Area Type
- District Borough Unitary Ward
- Area Size
- 3.1 km²
- Population
- 1519
- Population Density
- 491 people/km²
Demographics
The community profile of Southtown and Cobholm Ward reveals a distinctly older population. The median age for residents sits at 70 years, indicating that the area is dominated by older adults. While specific data on the most common age range is not detailed beyond the total age category, the high median age suggests a retirement-focused or mature demographic. Home ownership stands at 44%, meaning less than half of all households own their property outright. Consequently, more than half of the population likely rents their accommodation. This split influences the stability of the tenant mix within Southtown and Cobholm Ward. Accommodation types and predominant ethnic groups are recorded in the local statistics, reflecting the specific composition of this small ward. You should note that the household composition totals indicate a standard distribution for a UK ward, though the age factor skews the dynamic heavily towards older residents. Deprivation levels are not explicitly broken out here, but the age profile often correlates with specific lifestyle needs within the ward.
Household Size
Accommodation Type
Tenure
Ethnic Group
Religion
Household Composition
Age
Household Deprivation
NS-SEC
Explore more demographic insights in this area
Go to Demographics tabPlanning
Planning Constraints
- Flood RiskPremium
- Ramsar Wetland SitesPremium
- Area of Outstanding Natural BeautyPremium
- Protected Nature ReservePremium
- Protected WoodlandPremium