Area Overview for Sewell Ward
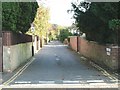
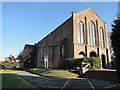
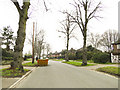
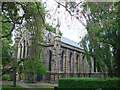
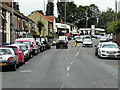
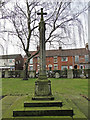
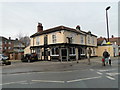
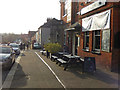
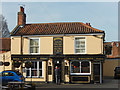
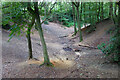
Photos of Sewell Ward


Area Information
Living in Sewell Ward means choosing a compact district where space is premium but connectivity remains high. This borough ward unit takes up just 1.3 square kilometres, yet it houses 1,576 residents. You find a population density of 1,171 people per square kilometre, creating a tightly knit environment within the unitary authority. This specific area of England offers a distinct scale for those who prefer a small footprint without sacrificing accessibility. Each acre holds more of a community footprint than sprawling suburbs, forcing daily interactions with neighbours. You move through a space where the proximity of homes defines a quick, walkable lifestyle. The sheer number of residents per square kilometre suggests a neighbourhood where services are concentrated and distances between points of interest are minimal. Your days here operate on a local rhythm rather than a commute-based schedule. This characteristic density shapes how families, seniors, and workers interact with the wider region. You settle into an area where the physical boundaries remain clear and manageable. Every home in Sewell Ward exists within this defined 1.3-kilometre square, offering a predictable and contained experience for all who choose to make it their base.
- Area Type
- District Borough Unitary Ward
- Area Size
- 1.3 km²
- Population
- 1576
- Population Density
- 1171 people/km²
Demographics
The community in Sewell Ward reflects a settled population with a median age of 70 years old. This figure confirms that the most common age group consists of older residents. When you look at household composition, the data indicates a total count without breaking down single-person living versus family units. Home ownership sits at 49%, meaning nearly half of the people living here own their homes outright or with a mortgage. The remaining 51% reside in rented accommodation, whether through social housing or private renting. You do not find detailed breakdowns regarding predominant ethnic groups or specific religious affiliations in the available records. Instead, the social structure revolves heavily around an older demographic and a split between owners and renters. This age profile often correlates with quieter streets and a slower pace of life compared to younger districts. Safety scores further paint a picture of standard precautions being necessary for all age groups. The medium crime risk score of 66 serves as a baseline for your daily security planning. You manage life in this ward knowing that neighbours are likely to be established and familiar with the local surroundings.
Household Size
Accommodation Type
Tenure
Ethnic Group
Religion
Household Composition
Age
Household Deprivation
NS-SEC
Explore more demographic insights in this area
Go to Demographics tabPlanning
Planning Constraints
- Flood RiskPremium
- Ramsar Wetland SitesPremium
- Area of Outstanding Natural BeautyPremium
- Protected Nature ReservePremium
- Protected WoodlandPremium
- Crime RiskPremium