Area Overview for Royston Palace Ward
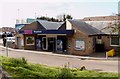
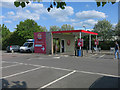
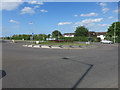
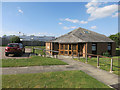
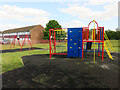
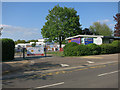
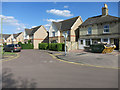
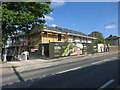
Photos of Royston Palace Ward
Area Information
Royston Palace Ward sits within North Hertfordshire, serving as a distinct administrative district in the town of Royston. This ward falls under the North East Hertfordshire parliamentary constituency, linking it to neighbours like Letchworth and Baldock. You live in an area where the boundary underwent significant revision in May 2024 following the North Hertfordshire (Electoral Changes) Order 2023. There are no planning constraints here regarding Ramsar wetland sites, Areas of Outstanding Natural Beauty, protected nature reserves, or protected woodland. The ward covers a total land area of 1.2 km², making it a compact community with a defined footprint. Residents benefit from a safe environment with low flood risk coverage, ensuring that water-based hazards do not impact daily life. The ward has existed as a council ward under specific historic boundary designations, though recent local government reviews altered its exact limits. Living in Royston Palace Ward means knowing exactly where you stand regarding local governance and environmental risks. You are part of a structure that balances historic continuity with modern electoral needs. The absence of protected status for certain natural features suggests that development could theoretically proceed without those specific ecological restrictions hindering progress. This clarity allows for a straightforward understanding of the ward's potential for change and stability.
- Area Type
- District Borough Unitary Ward
- Area Size
- 1.2 km²
- Population
- Not available
- Population Density
- Not available
Demographics
The community within Royston Palace Ward reflects a settled population where age plays a significant role in daily dynamics. The median age stands at 70, indicating that a large proportion of residents belong to the older generation. This demographic profile shapes the local services and social atmosphere, as most people in the area are likely to be retired or semi-retired. Home ownership is a dominant feature of life here, with 62% of households owning their residence outright or with a mortgage. This high rate of ownership suggests a stable community where families have long-term roots rather than temporary leases. Household composition data is recorded under a total category, meaning the specific breakdown of single-person versus multi-family homes is encompassed within the broader ward statistics. Accommodation types are similarly aggregated, providing a complete picture of the housing landscape without isolating specific building styles. There is no specified data provided for predominant ethnic groups or religious affiliations in the available records. While specific figures for these categories are not listed, the overall picture remains one of a homogeneous, locally anchored population. You can expect a neighbourhood where people have stayed for decades, reinforcing a sense of familiarity among residents. The age distribution and ownership levels create an environment defined less by transient youth and more by established households.
Household Size
Accommodation Type
Tenure
Ethnic Group
Religion
Household Composition
Age
Household Deprivation
NS-SEC
Explore more demographic insights in this area
Go to Demographics tabPlanning
Planning Constraints
- Flood RiskPremium
- Ramsar Wetland SitesPremium
- Area of Outstanding Natural BeautyPremium
- Protected Nature ReservePremium
- Protected WoodlandPremium