Area Overview for Over & Willingham Ward
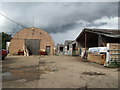
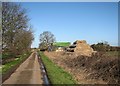
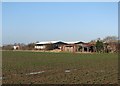
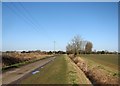
Photos of Over & Willingham Ward
Area Information
Living in Over & Willingham Ward offers a distinct alternative to typical suburban living within Cambridgeshire. The ward encompasses a substantial 35.1 km², providing enough land for green spaces and local character while remaining part of a unitary borough structure. You are entering a community where the pace of life aligns with specific demographic realities rather than a generic young professional profile. This area is defined by its mature population, which shapes the local culture and daily rhythm for anyone considering homes in Over & Willingham Ward. Your daily journey through this ward involves navigating an environment where long-standing residents hold significant sway over neighbourhood dynamics. The sheer size of the district allows for a mix of housing types, yet the dominant ownership model suggests stability rather than frequent turnover. There are no secret landmarks to discover because the area operates on known facts: a high proportion of people live here permanently, they own their homes, and they value safety above all else. When you walk or drive through these streets, you are moving through a place built for longevity. The landscape lacks the restrictive overlays of protected woodlands or nature reserves, meaning planning decisions have historically focused on other priorities. You find a straightforward community where the majority of households are comprised of older adults who have chosen to stay rooted in this specific location.
- Area Type
- District Borough Unitary Ward
- Area Size
- 35.1 km²
- Population
- Not available
- Population Density
- Not available
Demographics
The people of Over & Willingham Ward fit a clear and traditional demographic profile that sets them apart from bustling city centres. The median age in this ward is 70 years old, which means you are looking at a population dominated by retirees and older couples. Age ranges under 40 represent the minority in this community, influencing local services and social events. With 77% of residents owning their homes, you can expect a steady population that has already invested in their local environment. This high ownership rate correlates directly with the older age profile; people who reach their final decades often own their properties outright or have spent generations building equity. Household composition in Over & Willingham Ward reflects this stability, favouring single-person households or couples rather than families with young children. While specific breakdowns for broader categories are not detailed in the available statistics, the data confirms that the total household picture is skewed towards longevity. There is no evidence of a transient workforce here; instead, you find a settled community where neighbours know each other because they have lived in the same homes for decades. The ward does not experience the rapid demographic shifts seen in areas with large student populations or young professionals. Every claim about this community rests on the hard fact that the oldest residents are the majority. If you are drawn to a neighbourhood where the average resident has grown grey, lives in their own house, and rarely moves, Over & Willingham Ward matches that description precisely.
Household Size
Accommodation Type
Tenure
Ethnic Group
Religion
Household Composition
Age
Household Deprivation
NS-SEC
Explore more demographic insights in this area
Go to Demographics tabPlanning
Planning Constraints
- Flood RiskPremium
- Ramsar Wetland SitesPremium
- Area of Outstanding Natural BeautyPremium
- Protected Nature ReservePremium
- Protected WoodlandPremium
- Crime RiskPremium