Area Overview for Ockendon Ward
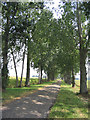
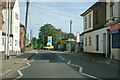
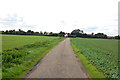
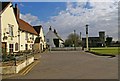
Photos of Ockendon Ward


Area Information
Ockendon Ward presents a compact residential district covering 11.5 square kilometres within the English borough structure. You will find 1,835 residents spread across this area, creating a living density of 159 people per square kilometre. This medium-density configuration suggests a neighbourhood that feels identifiable rather than sprawling, suitable for those seeking quiet living without complete isolation. The ward functions as a distinct administrative unit where residents likely rely on local infrastructure rather than extensive public transit networks commonly found in larger cities. Daily life here revolves around a contained community environment where every household is within a relatively short walk or drive of its neighbours. Prospective buyers looking for homes in Ockendon Ward must appreciate the trade-off of limited physical space in exchange for a strong sense of locality. The small geographic footprint means that services and routes are few and specific. You navigate this area knowing that proximity to amenities is defined by kilometres, not just minutes. The combination of population size and spread results in an area where community awareness is naturally high.
- Area Type
- District Borough Unitary Ward
- Area Size
- 11.5 km²
- Population
- 1835
- Population Density
- 159 people/km²
Demographics
The community profile in Ockendon Ward is defined by a significant presence of older residents. The median age stands at 70 years, indicating a population heavily skewed towards retirees. While the specific age breakdown lacks granular detail beyond this central figure, the overarching trend points to a settlement built for inhabitants in later life stages. Survey results show that 62% of households in the ward are owner-occupied. This high rate of home ownership reinforces the view of Ockendon Ward as a retirement or move-on destination rather than a young family hub dominated by rented accommodation. The balance of ownership suggests stability within the neighbourhood, with most residents having stayed long enough to purchase their properties. Diversity statistics for ethnicity and religion are not specified in the available records, so this aspect of the community remains undefined in current data. Household composition figures are similarly categorised broadly without specific breakdowns for single-person homes or family units. Deprivation indicators are not quantified, meaning you cannot assess economic disparity levels directly. The available data paints a picture of an older, property-owning community focused on established tenure.
Household Size
Accommodation Type
Tenure
Ethnic Group
Religion
Household Composition
Age
Household Deprivation
NS-SEC
Explore more demographic insights in this area
Go to Demographics tabPlanning
Planning Constraints
- Flood RiskPremium
- Ramsar Wetland SitesPremium
- Area of Outstanding Natural BeautyPremium
- Protected Nature ReservePremium
- Protected WoodlandPremium
- Crime RiskPremium