Area Overview for Haverhill North Ward
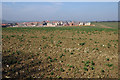
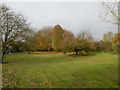
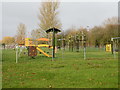
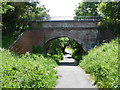
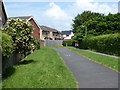
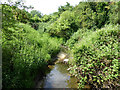
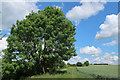
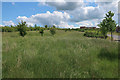
Photos of Haverhill North Ward
Area Information
Haverhill North Ward occupies a compact footprint of just 1.6 km² on the border of Suffolk and Essex. You will find a community defined by stability and a very mature population profile. With a median age of 70, this area is distinct from many other parts of Haverhill which feature younger families. Life here moves at a slower pace, characterised by well-established neighbourhoods rather than new developments. The ward represents a specific slice of the borough appealing largely to retirees or those seeking a quiet lifestyle close to the main town. Living in Haverhill North Ward means you benefit from strong digital infrastructure despite the older demographic. Connectivity scores indicate excellent broadband quality, ensuring residents remain connected to the wider world without physical constraints. Crime levels here are consistently low, providing a secure environment for daily walks. You can expect a neighbourhood free from major planning constraints such as protected woodlands or wetlands, offering flexibility for local development. This combination of safety, digital readiness, and a senior-focused demographic makes Haverhill North Ward a practical choice for those prioritising peace over property investment potential.
- Area Type
- District Borough Unitary Ward
- Area Size
- 1.6 km²
- Population
- Not available
- Population Density
- Not available
Demographics
The community in Haverhill North Ward has a clear demographic identity centred on older residents. Data shows a median age of 70 years, positioning this ward significantly older than the national average. You are not finding a bustling market of young professionals or families raising children; instead, the population is established and settled. Homeownership is the norm within this ward, with 67% of properties owned outright or with a mortgage. This high level of ownership suggests stability and long-term roots in the area. Household and accommodation composition data are recorded but do not specify detailed breakdowns, so you must assume standard variations typical of such wards. Diversity and religious data are not detailed in the provided figures, so the immediate impression is one of a homogeneous, age-specific community. While specific deprivation metrics are absent from the current dataset, the low crime risk score suggests a stable economic environment. The absence of young families might limit local playgroups or specific youth services. If you are looking for a dynamic mix of ages, this ward leans heavily towards retirement living. However, for someone seeking a quiet, owner-occupied environment, the statistics align perfectly with that need.
Household Size
Accommodation Type
Tenure
Ethnic Group
Religion
Household Composition
Age
Household Deprivation
NS-SEC
Explore more demographic insights in this area
Go to Demographics tabPlanning
Planning Constraints
- Flood RiskPremium
- Ramsar Wetland SitesPremium
- Area of Outstanding Natural BeautyPremium
- Protected Nature ReservePremium
- Protected WoodlandPremium
- Crime RiskPremium