Area Overview for Cranwich
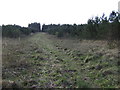
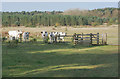
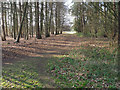
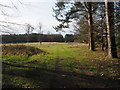
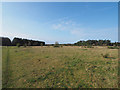
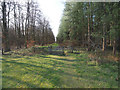
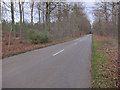
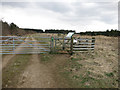
Photos of Cranwich
Area Information
Cranwich stands as a distinct civil parish covering an area of 7.4 km². This small, defined space forms its own geographic identity within the broader English landscape. Residents here experience life in a setting that prioritises local autonomy and community cohesion. The area operates with clear boundaries, offering a contained environment where daily routines revolve around immediate surroundings. People who live in Cranwich navigate a space where the scale is intimate enough to foster familiarity among neighbours. The parish structure suggests a level of local governance that addresses resident needs directly within these 7.4 km² limits. You will find that the layout supports a steady pace of life without the congestion found in larger towns. The sheer size remains modest, meaning that distances to key points of interest are short. This compact arrangement defines the character of homes in Cranwich, where the landscape dictates the rhythm of everyday activity. The area maintains its identity as a self-contained unit, separate from the wider municipal framework of the county.
- Area Type
- Parish
- Area Size
- 7.4 km²
- Population
- Not available
- Population Density
- Not available
Demographics
The community in Cranwich reflects a significant shift towards retirement living. The median age here sits at 70 years old, marking a clear distinction from national averages. Most residents fall into the higher end of the age spectrum, creating a quiet, subdued atmosphere typical of this demographic. With a home ownership rate of 75%, the population is predominantly settled rather than transient. Three out of every four households in Cranwich have secured certainty through property purchase or long-term tenure. This high level of ownership fosters stability, as residents often spend decades within the same homes. The area lacks significant young professional or family clusters, resulting in a community focused on leisure and established routines. You will observe fewer children playing outside during school hours, as the population composition favours older adults. The diversity breakdown indicates a population that has settled permanently, contributing to a homogenous social fabric. Data shows that total household and accommodation figures align with a model of quiet, settled living rather than dynamic, shifting demographics.
Household Size
Accommodation Type
Tenure
Ethnic Group
Religion
Household Composition
Age
Household Deprivation
NS-SEC
Explore more demographic insights in this area
Go to Demographics tabPlanning
Planning Constraints
- Flood RiskPremium
- Ramsar Wetland SitesPremium
- Area of Outstanding Natural BeautyPremium
- Protected Nature ReservePremium
- Protected WoodlandPremium