Area Overview for CM17 0PX
Photos of CM17 0PX
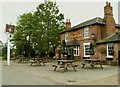
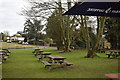
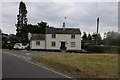
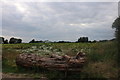
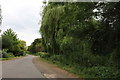
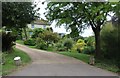
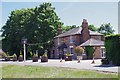
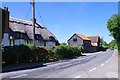
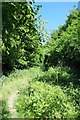


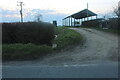
23 photos from this area
Area Information
Key information about the CM17 0PX including its size, population, and administrative classification.
- Area Type
- Postcode
- Area Size
- 4.4 hectares
- Population
- 2390
- Population Density
- 55 people/km²
House Prices in CM17 0PX
33
Properties
£245,955
Average Sold Price
£126,000
Lowest Price
£440,000
Highest Price
Showing 33 properties
| Address | Type | Beds | Baths | Last Sale Price | Last Sale Date | |
|---|---|---|---|---|---|---|
| 27 Colvers, Matching Green, Harlow, CM17 0PX | Semi-detached | 3 | - | £440,000 | Oct 2020 | |
| 32 Colvers, Matching Green, Harlow, CM17 0PX | Semi-detached | 3 | - | £378,000 | Nov 2014 | |
| 10 Colvers, Matching Green, Harlow, CM17 0PX | Semi-detached | 3 | - | £220,000 | Jan 2014 | |
| 3 Colvers, Matching Green, Harlow, CM17 0PX | house | - | - | £320,000 | Jul 2013 | |
| 9 Colvers, Matching Green, Harlow, CM17 0PX | Semi-detached | - | - | £218,000 | Jun 2012 | |
| 8 Colvers, Matching Green, Harlow, CM17 0PX | Semi-detached | - | - | £230,000 | Feb 2007 | |
| 28 Colvers, Matching Green, Harlow, CM17 0PX | Semi-detached | 3 | 2 | £216,500 | Apr 2006 | |
| 22 Colvers, Matching Green, Harlow, CM17 0PX | Terraced | - | - | £160,000 | Apr 2006 | |
| 2 Colvers, Matching Green, Harlow, CM17 0PX | house | - | - | £250,000 | Jan 2006 | |
| 12 Colvers, Matching Green, Harlow, CM17 0PX | Retail | 2 | 1 | £126,000 | Nov 2005 |
Page 1 of 4
Energy Efficiency in CM17 0PX
Amenities
Schools
| Rank | School | Type | Entry gender | Ages |
|---|
Explore more schools in this area
Go to Schools tabDemographics
Household Size
Two person
most common
Accommodation Type
Houses
most common
Tenure
76
majority
Ethnic Group
White
most common
Religion
N/A
most common
Household Composition
N/A
most common
Age
47
median
Adults (30-64 years)
most common
Household Deprivation
N/A
with no deprivation
NS-SEC
39
in Lower managerial occupations
Explore more demographic insights in this area
Go to Demographics tabPlanning
Planning Constraints
- Flood RiskPremium
- Ramsar Wetland SitesPremium
- Area of Outstanding Natural BeautyPremium
- Protected Nature ReservePremium
- Protected WoodlandPremium