Area Overview for Chalgrave
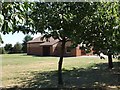
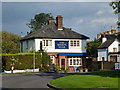
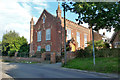
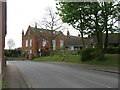
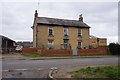
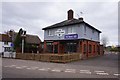
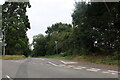
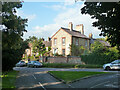
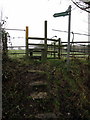
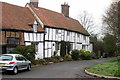
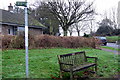
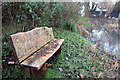
Photos of Chalgrave
Area Information
Chalgrave stands as a distinct civil parish within England, covering a total area of 9.2 km². Living in Chalgrave means settling into a relatively compact community where daily life is shaped by its specific geographical boundaries. This parish offers a defined sense of place for those seeking a rooted lifestyle away from larger cities. The area's size suggests a manageable environment where residents often know their neighbours. You can expect a traditional rural or semi-rural setting where the lane networks and open spaces define the character of the day-to-day experience. There is no ambiguity about the scale of your new home, as the parish limits are clearly established at just over nine square kilometres. When you walk the perimeter of Chalgrave, you are traversing a space designed for a specific community scale rather than urban sprawl. The identity of the area is solid, offering a clear boundary between this parish and its surroundings. Prospective buyers looking for a defined locality will find Chalgrave provides a tangible scope for their future residence. The sheer size of the parish ensures you are not cramming into a micro-location, yet it remains small enough to foster connectivity between residents. Each street in Chalgrave contributes to a cohesive picture of a self-contained neighbourhood with a clear identity and purpose.
- Area Type
- Parish
- Area Size
- 9.2 km²
- Population
- Not available
- Population Density
- Not available
Demographics
The population dynamics in Chalgrave reveal a community dominated by older residents. The median age here is 70, indicating that a significant portion of the population falls well into retirement age. This demographic profile suggests a quiet atmosphere where day-to-day life revolves around leisure and established routines rather than youthful energy or nightlife. You are looking at an area where the average household member is significantly older than the national norm. With a home ownership rate standing at 81%, most residents have bought their properties outright or own them with a mortgage. This high level of ownership creates a stable environment where long-term settlement is the norm. There is very little turnover in tenancy, as the vast majority of homes are owner-occupied rather than part of the private rental market. The age structure means that schools may be less critical to daily logistics for this specific demographic compared to younger districts. Community groups likely cater to pensioners, creating social networks centred on shared later-life experiences. When you evaluate living in Chalgrave, you are entering a mature market where tenure security is exceptionally high. The population composition reflects a settled community where few residents are likely to move within the year. This stability offers a predictable environment for anyone choosing to locate their home here.
Household Size
Accommodation Type
Tenure
Ethnic Group
Religion
Household Composition
Age
Household Deprivation
NS-SEC
Explore more demographic insights in this area
Go to Demographics tabPlanning
Planning Constraints
- Flood RiskPremium
- Ramsar Wetland SitesPremium
- Area of Outstanding Natural BeautyPremium
- Protected Nature ReservePremium
- Protected WoodlandPremium
- Crime RiskPremium