Area Overview for Shirland Ward
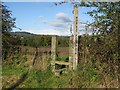
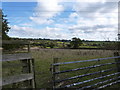
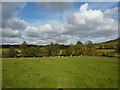
Photos of Shirland Ward


Area Information
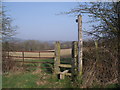
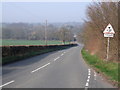
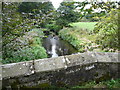
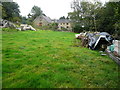
Living in Shirland Ward offers a distinct experience within a district borough unitary ward in England. This area spans 22.2 km² and holds a population of just 1350 residents. Such a small population density means the neighbourhood remains quiet, with housing situated in a relatively spacious context. The environment avoids the chaos of larger urban centres, providing a setting where daily life moves at a slower pace. You will find that life here is defined by proximity to nature rather than city congestion. The landscape includes specific planning constraints that shape the visual character of the ward. For instance, protected woodland covers a small portion of this space, influencing development and preserving green corridors. While the area lacks Ramsar wetland sites, Areas of Outstanding Natural Beauty, or designated protected nature reserves, the presence of woodland adds a layer of natural value. Homes in this ward sit in an area where some planning constraints are flagged as warnings rather than passes, yet the overall risk profile remains manageable. The community is tightly knit, reflecting off the modest resident count. You are buying into a place where space and local knowledge define the lifestyle.
- Area Type
- District Borough Unitary Ward
- Area Size
- 22.2 km²
- Population
- 1350
- Population Density
- 1141 people/km²
Demographics
The community in Shirland Ward reflects a settled, older population structure. With a median age of 70, the demographic skew is heavily towards senior residents. You are looking at a neighbourhood where age: total dominates the profile, indicating a lack of significant younger family clusters. This age profile shapes local habits and service needs, creating a specific rhythm to the area. Only 57% of households report ownership, meaning nearly half of the residents rely on the rental market. This split suggests a mix of long-term owners and those moving for housing association or private rentals. Accommodation types and household composition data confirm this settled nature without specific breakdowns provided for those categories. The religious and ethnic makeup is summarised as a total figure without further fragmentation, hinting at a homogeneous community. While specific deprivation data is absent from the current overview, the transport and infrastructure scores provide insight into connectivity. The area does not suffer from extreme isolation in terms of digital connection. Living in Shirland Ward means engaging with a mature demographic in a setting where traditional housing and rental options coexist. The stability of the age group suggests low churning and consistent neighbours.
Household Size
Accommodation Type
Tenure
Ethnic Group
Religion
Household Composition
Age
Household Deprivation
NS-SEC
Explore more demographic insights in this area
Go to Demographics tabPlanning
Planning Constraints
- Flood RiskPremium
- Ramsar Wetland SitesPremium
- Area of Outstanding Natural BeautyPremium
- Protected Nature ReservePremium
- Protected WoodlandPremium
- Crime RiskPremium