Area Overview for Nottingham
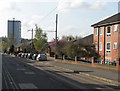
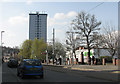
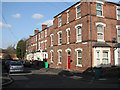
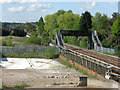
Photos of Nottingham
Area Information
Living in Nottingham offers a compact living experience within a distinctly local authority borough. The district covers an area size of 60.4 square kilometres, which contributes to a population density of 3,469 people per square kilometre. You will find 209,585 residents calling this borough home, creating an environment where daily interactions are frequent yet rooted in a defined local jurisdiction. The identity of Nottingham as a unitary district means local governance and community services are managed at a centralised level, potentially streamlining decision-making regarding neighbourhood improvements. Despite the relatively small geographical footprint compared to larger metropolitan counties, the population concentration ensures that amenities are generally within easy reach. This density often translates to vibrant local high streets and accessible public spaces, though it can also mean limited room for sprawl. Prospective homebuyers should appreciate that the borough is a self-contained unit where the boundary is clear and the community footprint is tight. You are purchasing a home in a place where the average person knows their neighbours, and the scale remains manageable. The character of the area is defined by this moderate density rather than vast open spaces or isolated rural patches. Understanding this demographic and geographic profile helps you gauge the pace of life you will experience day to day.
- Area Type
- Built Up Area 250
- Area Size
- 60.4 km²
- Population
- 209585
- Population Density
- 3469 people/km²
Amenities
Schools
| Rank | School | Type | Entry gender | Ages |
|---|
Explore more schools in this area
Go to Schools tabDemographics
The community profile of Nottingham reflects a settled population with a median age of 70 years. This figure stands out as notably high for a district of its population size. The predominant age grouping is marked simply as 'Age: Total' in available records, suggesting the dataset aggregates all ages without breaking down specific younger cohorts. With 209,585 inhabitants, the social fabric has likely matured, yet exact breakdowns of singles versus families remain abstract in the current data. You will encounter a household structure that supports this older median, although specific percentages for single-person homes or family units are not detailed in the standard breakdowns. Home ownership sits at exactly 48 per cent of the resident population. This statistic indicates a balanced market where nearly half of you buy into the area, while the other half remains in rented accommodations. The accommodation type records are labelled as 'total', confirming a mix of houses and flats without specifying the ratio. Deprivation metrics are not included in the provided assessment, so you cannot quantify economic disparity locally. Instead, focus on the ownership split which suggests a stable, long-term residential base rather than a transient rental sector. The 3,469 people per square kilometre density supports this sense of permanence.
Household Size
Accommodation Type
Tenure
Ethnic Group
Religion
Household Composition
Age
Household Deprivation
NS-SEC
Explore more demographic insights in this area
Go to Demographics tabPlanning
Planning Constraints
- Crime RiskPremium