Area Overview for Northall Ward
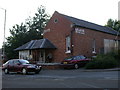
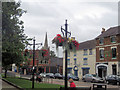
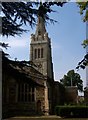
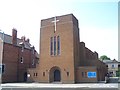
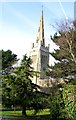
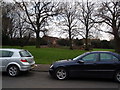
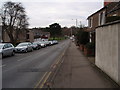
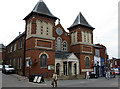
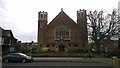
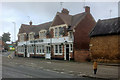
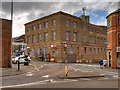
Photos of Northall Ward

Area Information
Northall Ward covers 4.9 square kilometres of district borough unitary ward within England. Living in this compact area involves navigating a specific residential landscape defined by its demographics and physical constraints. You will find a community where the median age is 70, indicating a predominantly older population compared to many other districts. This demographic profile shapes the daily rhythm of the neighbourhood, with services and activities likely catering to older residents. The area does not suffer from major planning constraints, as there are no Ramsar wetland sites, Areas of Outstanding Natural Beauty, protected nature reserves, or protected woodland within its boundaries. This classification suggests the land use is not restricted by environmental protections, which can influence local development potential. Safety is a mixed factor for anyone considering homes in Northall Ward. While flood risk remains low with a score of 2.85 out of 100, crime risk registers at medium. The crime score stands at 41 out of 100, meaning rates are around average and standard security precautions are advisable. A high-speed fixed broadband score of 95 out of 100 confirms that digital infrastructure is excellent, removing connectivity as a barrier for remote workers. You should expect a quiet, somewhat ageing environment where practical safety measures are as important as enjoying the lack of protected land constraints.
- Area Type
- District Borough Unitary Ward
- Area Size
- 4.9 km²
- Population
- Not available
- Population Density
- Not available
Demographics
The community in Northall Ward is distinctly characterised by an elderly population. The median age is 70, which is a significant detail for anyone looking to understand the social fabric of the area. This age profile suggests a retirement or semi-retirement community rather than a young family hub. Home ownership plays a central role in this society, with 50% of households owning their properties. This figure indicates an equal split between homeowners and renters, creating a diverse stakeholder group within the ward. You will encounter a mix of residents dependent on pensions alongside those in rented accommodation. The lack of specific data on predominant ethnic groups, religion, or detailed household compositions means the ethnic and cultural diversity profile remains unquantified in current records. However, the demographic focus on age is clear and impacts local demand. Deprivation levels are not explicitly detailed in the provided figures, so you must judge quality of life based on the structural data available. The high concentration of older residents often correlates with a slower pace of life and specific needs regarding healthcare and social care services. Understanding that half the population owns their home while the other half rents helps you gauge stability and turnover rates when viewing flats in Northall Ward.
Household Size
Accommodation Type
Tenure
Ethnic Group
Religion
Household Composition
Age
Household Deprivation
NS-SEC
Explore more demographic insights in this area
Go to Demographics tabPlanning
Planning Constraints
- Flood RiskPremium
- Ramsar Wetland SitesPremium
- Area of Outstanding Natural BeautyPremium
- Protected Nature ReservePremium
- Protected WoodlandPremium
- Crime RiskPremium