Area Overview for NG1 4EN
Photos of NG1 4EN
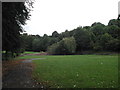
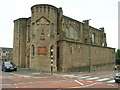
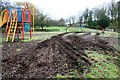
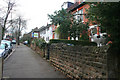
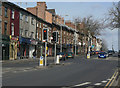
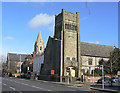
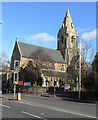
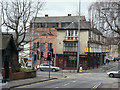
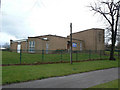
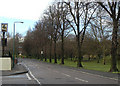
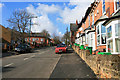
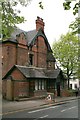
100 photos from this area
Area Information
Key information about the NG1 4EN including its size, population, and administrative classification.
- Area Type
- Postcode
- Area Size
- 3909 m²
- Population
- 2440
- Population Density
- 10112 people/km²
House Prices in NG1 4EN
48
Properties
£242,425
Average Sold Price
£242,425
Lowest Price
£242,425
Highest Price
Showing 48 properties
| Address | Type | Beds | Baths | Last Sale Price | Last Sale Date | |
|---|---|---|---|---|---|---|
| 244 North Sherwood Street, Nottingham, NG1 4EN | Terraced | 1 | 2 | £242,425 | Jul 2006 | |
| 242 North Sherwood Street, Nottingham, NG1 4EN | Terraced | 6 | 2 | £242,425 | Jul 2006 | |
| 240 North Sherwood Street, Nottingham, NG1 4EN | house | - | - | £242,425 | Jul 2006 | |
| 254 North Sherwood Street, Nottingham, NG1 4EN | Flat | 4 | 1 | - | - | |
| 274 North Sherwood Street, Nottingham, NG1 4EN | Flat | 4 | 1 | - | - | |
| 274B North Sherwood Street, Nottingham, NG1 4EN | Flat | 4 | 1 | - | - | |
| Flat 2, 253 Mansfield Road, Nottingham, NG1 4EN | Flat | - | - | - | - | |
| Flat 1, 253-255 Mansfield Road, Nottingham, NG1 4EN | Flat | - | - | - | - | |
| Flat 5, 253-255 Mansfield Road, Nottingham, NG1 4EN | Flat | - | - | - | - | |
| Flat 3, 253 Mansfield Road, Nottingham, NG1 4EN | Flat | - | - | - | - |
Page 1 of 5
Energy Efficiency in NG1 4EN
Amenities
Schools
| Rank | School | Type | Entry gender | Ages |
|---|
Explore more schools in this area
Go to Schools tabDemographics
Household Size
Family (3-5 people)
most common
Accommodation Type
Houses
most common
Tenure
15
majority
Ethnic Group
White
most common
Religion
N/A
most common
Household Composition
N/A
most common
Age
22
median
Young Adults (15-29 years)
most common
Household Deprivation
N/A
with no deprivation
NS-SEC
10
in Lower managerial occupations
Explore more demographic insights in this area
Go to Demographics tabPlanning
Planning Constraints
- Flood RiskPremium
- Ramsar Wetland SitesPremium
- Area of Outstanding Natural BeautyPremium
- Protected Nature ReservePremium
- Protected WoodlandPremium