Area Overview for Matlock East & Tansley Ward
Photos of Matlock East & Tansley Ward
Area Information
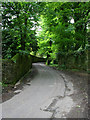
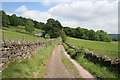
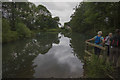
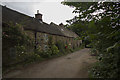
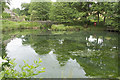
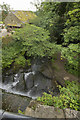
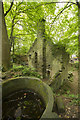
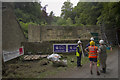
Matlock East & Tansley Ward stands as a distinct electoral ward within the Derbyshire Dales District Council in the East Midlands region. You can find this area located in the south-eastern Peak District, encompassing parts of Matlock East and the village of Tansley. The ward covers a total area of 15.2 km² and is home to a population of 1,601 residents. This setting places the location approximately 9 miles south-west of Chesterfield, 19 miles from Derby, 20 miles from Sheffield, and 29 miles from Nottingham. The position offers proximity to Matlock town, which serves as the county town of Derbyshire. Residents benefit from access to the A6, known as Dale Road, which connects the area between Matlock Bridge and Matlock Bath as part of the major Derby to Manchester route. Nearby transport hubs include Matlock railway station, Matlock Bath station, and Cromford station. Bus services operate within the Matlock and Tansley area to support daily travel needs. Living in Matlock East & Tansley Ward means residing in a compact rural ward with defined geographical boundaries and established transport links to larger urban centres.
- Area Type
- District Borough Unitary Ward
- Area Size
- 15.2 km²
- Population
- 1601
- Population Density
- 106 people/km²
Demographics
The community profile for Matlock East & Tansley Ward shows a distinct demographic structure centred on older residents. The median age in this ward is 70 years, making it one of the most age-weighted areas in the region. Although the most common age range data is listed as total, the high median age indicates that the population consists primarily of retirees or older adults. You will find that 68% of households in this ward are owner-occupied, reflecting a community where long-term residency and home ownership are common. The remaining 32% of residents rent their homes. The ward contains 1,601 people spread across its 15.2 km² footprint, resulting in a population density of 106 people per km². This low density contributes to a quiet living environment with significant green space. The data does not specify details regarding household composition breakdowns beyond the total category, nor does it provide specific figures for predominant ethnic groups or religious breakdowns. Consequently, the demographic picture is defined largely by age and ownership patterns rather than detailed social diversity metrics.
Household Size
Accommodation Type
Tenure
Ethnic Group
Religion
Household Composition
Age
Household Deprivation
NS-SEC
Explore more demographic insights in this area
Go to Demographics tabPlanning
Planning Constraints
- Flood RiskPremium
- Ramsar Wetland SitesPremium
- Area of Outstanding Natural BeautyPremium
- Protected Nature ReservePremium
- Protected WoodlandPremium
- Crime RiskPremium