Area Overview for LN2 4AS
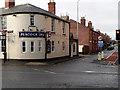
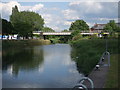
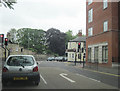
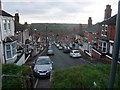
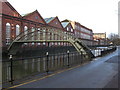
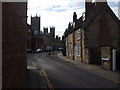
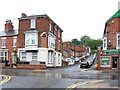
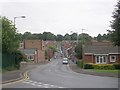
Photos of LN2 4AS
Area Information
LN2 4AS is a small, tightly packed residential postcode in England, covering just 2,760 square metres and home to 1,827 residents. Its high population density of 661,940 people per square kilometre reflects a compact, closely knit community. This area is characterised by its modest size and the presence of family-oriented housing, with a median age of 47 and a majority of residents aged 30–64. Daily life here is shaped by proximity to local amenities, with shops, rail links, and schools within practical reach. The area’s small footprint means it is likely surrounded by larger towns or rural landscapes, offering a blend of urban convenience and quieter surroundings. While the population is predominantly White and home ownership stands at 56%, the area’s compact nature fosters a sense of familiarity among residents. For buyers, LN2 4AS presents a niche opportunity to live in a well-serviced, low-flood-risk zone, though the medium crime risk score suggests standard security precautions are advisable.
- Area Type
- Postcode
- Area Size
- 2760 m²
- Population
- 1827
- Population Density
- 2768 people/km²
The property market in LN2 4AS is defined by its compact size and focus on houses. With 56% of homes owned by residents, the area leans toward owner-occupation, though the remaining 44% are likely rentals. The predominance of houses, rather than flats or apartments, suggests a traditional, family-friendly housing stock. Given the area’s small footprint, the number of properties available is limited, which may create competition among buyers. The high population density indicates that properties are closely spaced, potentially offering a sense of community but with less private space. For buyers, the area’s proximity to schools, rail links, and retail hubs adds practical appeal, though the medium crime risk score means security considerations should be factored into property decisions. The lack of protected natural areas or planning constraints may also make the area more adaptable for development or renovation.
House Prices in LN2 4AS
Showing 28 properties
| Address | Type | Beds | Baths | Last Sale Price | Last Sale Date | |
|---|---|---|---|---|---|---|
| 17 The Cloisters, Lincoln, LN2 4AS | Flat | 3 | 2 | £230,000 | Aug 2025 | |
| 10 The Cloisters, Lincoln, LN2 4AS | Flat | - | - | £153,500 | Mar 2023 | |
| 12 The Cloisters, Lincoln, LN2 4AS | Flat | - | - | £175,500 | Nov 2022 | |
| 1 The Cloisters, Lincoln, LN2 4AS | Semi-detached | 3 | 2 | £250,000 | Aug 2022 | |
| 20 The Cloisters, Lincoln, LN2 4AS | Retail | 3 | 2 | £230,000 | Jul 2022 | |
| 28 The Cloisters, Lincoln, LN2 4AS | Maisonette | 1 | 1 | £157,000 | Apr 2022 | |
| 22 The Cloisters, Lincoln, LN2 4AS | Flat | - | - | £149,500 | Nov 2021 | |
| 11 The Cloisters, Lincoln, LN2 4AS | Flat | - | - | £150,000 | Sep 2021 | |
| 5 The Cloisters, Lincoln, LN2 4AS | Terraced | 4 | - | £275,000 | Jun 2021 | |
| 6 The Cloisters, Lincoln, LN2 4AS | house | 3 | 2 | £200,000 | Dec 2020 |
Energy Efficiency in LN2 4AS
Living in LN2 4AS offers access to a variety of retail and service amenities. Local shops such as Lincolnshire Co-operative Co, Tesco Lincoln, and Heron Lincoln provide everyday essentials, while the nearby rail stations connect residents to broader networks for travel or commuting. The presence of RAF Waddington and RAF Scampton may offer unique employment or recreational opportunities for those in the military or aviation sectors. Though the area is small, its proximity to rail links and major roads ensures practical reach to larger towns and cities. The mix of retail, transport, and military facilities contributes to a functional lifestyle, balancing convenience with the potential for a quieter, community-focused environment.
Amenities
Schools
Residents of LN2 4AS have access to a range of educational institutions, including both state and independent schools. The Lincoln St Peter-in-Eastgate Church of England (Controlled) Infants School is a primary school with an Ofsted rating of satisfactory, providing a publicly funded option for younger children. Independent schools such as St Mary’s School, The Cathedral School, and Stonefield House School offer alternative educational pathways, often with smaller class sizes and specialised curricula. The Lincolnshire College of Art and Design, categorised as an other institution, may cater to further education or vocational training. This mix of school types allows families to choose between state and private education, though the independent options may come with higher costs. The presence of multiple schools within reach suggests the area is well-suited for families prioritising educational choices.
| Rank | School | Type | Entry gender | Ages |
|---|
Explore more schools in this area
Go to Schools tabDemographics
The community in LN2 4AS is predominantly composed of adults aged 30–64, with a median age of 47. This suggests a mature, stable population, likely with established careers and family structures. Home ownership is at 56%, indicating a mix of owner-occupied properties and rentals, though the exact proportion of rental homes is not specified. The predominant accommodation type is houses, which aligns with the area’s small size and residential focus. The population is overwhelmingly White, with no specific data on other ethnic groups, though this may reflect broader regional demographics. The high population density—over 660,000 people per square kilometre—implies limited space per household, which could influence the character of daily life, with shared amenities and close neighbourly interactions. While deprivation data is not provided, the absence of protected natural areas or planning constraints suggests the area is developed for residential use rather than conservation.
Household Size
Accommodation Type
Tenure
Ethnic Group
Religion
Household Composition
Age
Household Deprivation
NS-SEC
Explore more demographic insights in this area
Go to Demographics tabPlanning
Planning Constraints
- Flood RiskPremium
- Ramsar Wetland SitesPremium
- Area of Outstanding Natural BeautyPremium
- Protected Nature ReservePremium
- Protected WoodlandPremium