Area Overview for Leicester
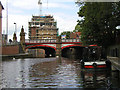
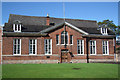
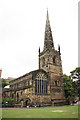
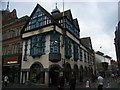
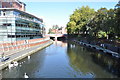
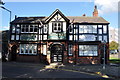
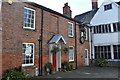
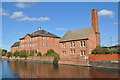
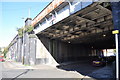
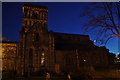
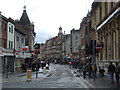
Photos of Leicester
Area Information
Leicester stands as a significant unitary authority city within the East Midlands, serving as the county town for Leicestershire. You are considering a location that encompasses approximately 73.0 km² of urban and suburban space. The city centre and surrounding wards, including Aylestone, Belgrave, Evington, Humberstone, and Knighton, form the core of what you would call home. With a population of around 250,330, this district borough unitary offers a density of 3,431 people per km², placing it firmly in the category of a medium-sized urban centre rather than a sprawling metropolis. Living in Leicester means engaging with a local authority district that has historical roots dating back to its time as a Roman settlement known as Ratae Corieltauvorum. The area has evolved through Saxon burh status and preceded its current integration into Leicestershire under the Local Government Act 1972. It regained unitary authority status on 1 April 1997. The daily reality for residents involves navigating a community associated with notable figures like the founders of Walkers Crisps. You are moving into an area defined by its central position within the county and its established history, rather than冲进 a generic modern development. The geography covers a consistent urban area that includes the main city centre and extends outwards into specific residential wards.
- Area Type
- District/Borough
- Area Size
- 73.0 km²
- Population
- 250330
- Population Density
- 3431 people/km²
Demographics
The community profile in Leicester reveals a distinct demographic split. You will find that half of the city's inhabitants are aged sixty or older, as the median age stands at exactly 70. This figure indicates a population heavily weighted towards retirement and senior living. The most common age range classifications in the records show a total overview without granular breakdowns for younger cohorts. This age structure likely influences local services and community dynamics. Home ownership represents a significant portion of the housing stability in the area, standing at precisely 53%. This means that roughly half of the population owns their homes outright or with a mortgage, while the other half likely rents. The household composition data lists a total category, suggesting a mixed environment of single-person homes, families, and older couples sharing properties. Accommodation types are recorded as a total figure, reflecting the variety of housing available without specific emphasis on a single dwelling style. While the area links to figures like the Walkers Crisps founders, specific data on the predominant ethnic groups and religious affiliations is not detailed in the current records. You should focus on the tangible statistics available: a city with a median age of 70 and a 53% ownership rate. Safety assessments provide a clearer picture of daily life than demographic speculation. The crime risk sits at a medium level, rated 52 out of 100, which is roughly average for a district of this size. This suggests you need standard security precautions but should not expect high rates of concern.