Area Overview for LE2 7EF
Photos of LE2 7EF
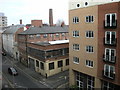
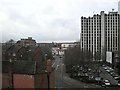
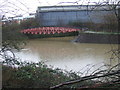
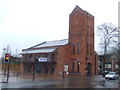
100 photos from this area
Area Information
Key information about the LE2 7EF including its size, population, and administrative classification.
- Area Type
- Postcode
- Area Size
- 6551 m²
- Population
- 3525
- Population Density
- 8846 people/km²
House Prices in LE2 7EF
61
Properties
£144,975
Average Sold Price
£130,000
Lowest Price
£159,950
Highest Price
Showing 61 properties
| Address | Type | Beds | Baths | Last Sale Price | Last Sale Date | |
|---|---|---|---|---|---|---|
| Flat 14, Deacon House, 34 Deacon Street, Leicester, LE2 7EF | Flat | - | - | £130,000 | Apr 2005 | |
| Flat 16, Deacon House, 34 Deacon Street, Leicester, LE2 7EF | Flat | - | - | £159,950 | Mar 2004 | |
| Flat 39, Jarrom Court, 40 Deacon Street, Leicester, LE2 7EF | Flat | 3 | - | - | - | |
| 34A Deacon Street, Leicester, LE2 7EF | Flat | - | - | - | - | |
| Flat 55, Jarrom Court, 40 Deacon Street, Leicester, LE2 7EF | Flat | - | - | - | - | |
| Flat 62, Jarrom Court, 40 Deacon Street, Leicester, LE2 7EF | Flat | - | - | - | - | |
| Flat 59, Jarrom Court, 40 Deacon Street, Leicester, LE2 7EF | Flat | - | - | - | - | |
| Flat 73, Jarrom Court, 40 Deacon Street, Leicester, LE2 7EF | Flat | - | - | - | - | |
| Flat 65, Jarrom Court, 40 Deacon Street, Leicester, LE2 7EF | Flat | - | - | - | - | |
| Flat 58, Jarrom Court, 40 Deacon Street, Leicester, LE2 7EF | Flat | - | - | - | - |
Page 1 of 7
Energy Efficiency in LE2 7EF
Amenities
Schools
| Rank | School | Type | Entry gender | Ages |
|---|
Explore more schools in this area
Go to Schools tabDemographics
Household Size
One person
most common
Accommodation Type
Flats
most common
Tenure
6
majority
Ethnic Group
White
most common
Religion
N/A
most common
Household Composition
N/A
most common
Age
22
median
Young Adults (15-29 years)
most common
Household Deprivation
N/A
with no deprivation
NS-SEC
13
in Lower managerial occupations
Explore more demographic insights in this area
Go to Demographics tabPlanning
Planning Constraints
- Flood RiskPremium
- Ramsar Wetland SitesPremium
- Area of Outstanding Natural BeautyPremium
- Protected Nature ReservePremium
- Protected WoodlandPremium