Area Overview for LE11 3BE
Photos of LE11 3BE
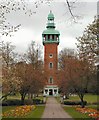
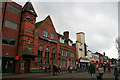
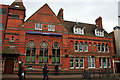
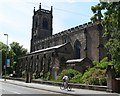
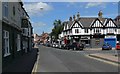
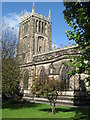
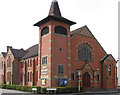
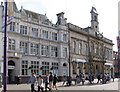
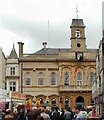
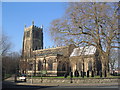
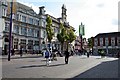
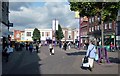
100 photos from this area
Area Information
Key information about the LE11 3BE including its size, population, and administrative classification.
- Area Type
- Postcode
- Area Size
- 4436 m²
- Population
- 2059
- Population Density
- 5807 people/km²
House Prices in LE11 3BE
27
Properties
£134,676
Average Sold Price
£40,000
Lowest Price
£265,000
Highest Price
Showing 27 properties
| Address | Type | Beds | Baths | Last Sale Price | Last Sale Date | |
|---|---|---|---|---|---|---|
| 30 Chestnut Street, Loughborough, LE11 3BE | house | - | - | £265,000 | Oct 2024 | |
| 5 Chestnut Street, Loughborough, LE11 3BE | house | - | - | £265,000 | Aug 2024 | |
| 28 Chestnut Street, Loughborough, LE11 3BE | house | - | - | £245,000 | Apr 2021 | |
| 11 Chestnut Street, Loughborough, LE11 3BE | house | - | - | £200,000 | Apr 2020 | |
| 13 Chestnut Street, Loughborough, LE11 3BE | house | - | - | £187,000 | Jun 2015 | |
| 9 Chestnut Street, Loughborough, LE11 3BE | house | - | - | £138,000 | Sep 2008 | |
| 3 Chestnut Street, Loughborough, LE11 3BE | house | - | - | £148,000 | Jun 2008 | |
| 2 Chestnut Street, Loughborough, LE11 3BE | house | - | - | £140,000 | Mar 2007 | |
| 7 Chestnut Street, Loughborough, LE11 3BE | house | - | - | £135,000 | Jun 2006 | |
| 1 Chestnut Street, Loughborough, LE11 3BE | house | - | - | £180,000 | Jan 2006 |
Page 1 of 3
Energy Efficiency in LE11 3BE
Amenities
Schools
| Rank | School | Type | Entry gender | Ages |
|---|
Explore more schools in this area
Go to Schools tabDemographics
Household Size
Family (3-5 people)
most common
Accommodation Type
Houses
most common
Tenure
34
majority
Ethnic Group
White
most common
Religion
N/A
most common
Household Composition
N/A
most common
Age
22
median
Young Adults (15-29 years)
most common
Household Deprivation
N/A
with no deprivation
NS-SEC
15
in Lower managerial occupations
Explore more demographic insights in this area
Go to Demographics tabPlanning
Planning Constraints
- Flood RiskPremium
- Ramsar Wetland SitesPremium
- Area of Outstanding Natural BeautyPremium
- Protected Nature ReservePremium
- Protected WoodlandPremium