Area Overview for LE11 2EG
Photos of LE11 2EG
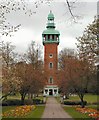
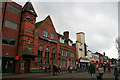
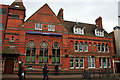
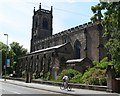
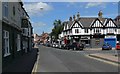
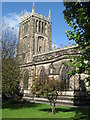
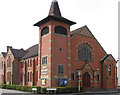
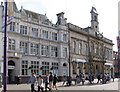
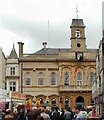
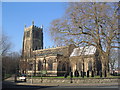
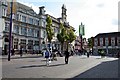
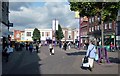
100 photos from this area
Area Information
Key information about the LE11 2EG including its size, population, and administrative classification.
- Area Type
- Postcode
- Area Size
- 5896 m²
- Population
- 1459
- Population Density
- 2925 people/km²
House Prices in LE11 2EG
47
Properties
£312,635
Average Sold Price
£119,075
Lowest Price
£625,000
Highest Price
Showing 47 properties
| Address | Type | Beds | Baths | Last Sale Price | Last Sale Date | |
|---|---|---|---|---|---|---|
| 5 Park Street, Loughborough, LE11 2EG | Flat | 2 | 1 | £345,000 | Feb 2024 | |
| 7A Park Street, Loughborough, LE11 2EG | house | - | - | £625,000 | Jun 2023 | |
| 2 Park Street, Loughborough, LE11 2EG | house | - | - | £405,000 | Jun 2022 | |
| 10 Park Street, Loughborough, LE11 2EG | Terraced | 3 | 1 | £310,000 | Feb 2022 | |
| 20 Park Street, Loughborough, LE11 2EG | house | - | - | £200,000 | May 2021 | |
| 6 Park Street, Loughborough, LE11 2EG | house | - | - | £420,000 | Feb 2021 | |
| 1 Park Street, Loughborough, LE11 2EG | house | - | - | £410,000 | Jan 2021 | |
| 12 Park Street, Loughborough, LE11 2EG | Terraced | 5 | 2 | £480,000 | Dec 2020 | |
| 4 Park Street, Loughborough, LE11 2EG | house | - | - | £375,500 | Jun 2020 | |
| 9 Park Street, Loughborough, LE11 2EG | house | - | - | £179,950 | Dec 2019 |
Page 1 of 5
Energy Efficiency in LE11 2EG
Amenities
Schools
| Rank | School | Type | Entry gender | Ages |
|---|
Explore more schools in this area
Go to Schools tabDemographics
Household Size
One person
most common
Accommodation Type
Flats
most common
Tenure
31
majority
Ethnic Group
White
most common
Religion
N/A
most common
Household Composition
N/A
most common
Age
22
median
Young Adults (15-29 years)
most common
Household Deprivation
N/A
with no deprivation
NS-SEC
19
in Lower managerial occupations
Explore more demographic insights in this area
Go to Demographics tabPlanning
Planning Constraints
- Flood RiskPremium
- Ramsar Wetland SitesPremium
- Area of Outstanding Natural BeautyPremium
- Protected Nature ReservePremium
- Protected WoodlandPremium