Area Overview for East Retford South Ward
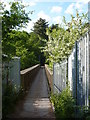
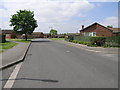
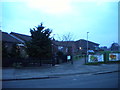
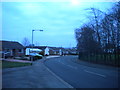
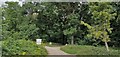
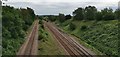
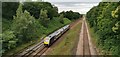
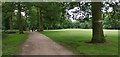
Photos of East Retford South Ward
Area Information
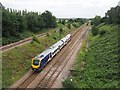
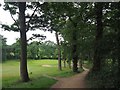
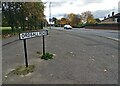
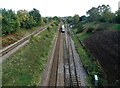
Living in East Retford South Ward offers a specific type of rural existence characterised by tight-knit communities and a connection to the natural surrounds. This district borough unitary ward covers an area of just 3.0 km², creating a compact environment where local stories and routines intersect frequently. With a population of 1,417 residents, the ward maintains a low-density feel that many seek when moving away from urban centres. The average density stands at 475 people per km², ensuring that while the area is residential, it avoids the congestion typical of larger towns. You will find this ward situated in Nottinghamshire, England, providing a stable base for those who prioritise space and quiet over city-life immediacy. The small size means that daily life relies heavily on local amenities and personal transport, fostering a sense of independence for residents. Prospective buyers should recognise that this ward functions as a distinct micro-community within the broader East Retford area. It is a place defined by its manageable scale rather than sprawling developments. The demographic profile suggests a mature community, which influences the character of local shops and services. Understanding these fundamentals helps you decide if this specific ward matches your lifestyle requirements for a rural home.
- Area Type
- District Borough Unitary Ward
- Area Size
- 3.0 km²
- Population
- 1417
- Population Density
- 475 people/km²
Demographics
The community in East Retford South Ward reflects a distinctly mature society shaped by its age profile and ownership patterns. The median age for residents settles at 70 years, indicating that the majority of the population comprises older adults. This demographic shift influences the social fabric and the type of activities that dominate the ward. While the most common age range data lacks a specific breakdown, the high median age points towards a settlement retained by those retiring to rural settings or staying put throughout their later years. Home ownership is a defining feature of local life, with 65% of households owned outright or via mortgage. This high level of tenure stability often contributes to lower household mobility compared to rental-dominant areas. The data does not provide specific details on household composition, ethnicity, or religion, but the ownership figure strongly suggests a settled population with deep local roots. For those considering moving here, you are entering an environment where property values are likely stable, supported by the fact that two-thirds of residents call this place home. The social dynamics will centre around neighbourliness and shared history rather than transient interactions found in student or commuter hubs. This demographic reality shapes the availability of local services to meet the needs of an older population.
Household Size
Accommodation Type
Tenure
Ethnic Group
Religion
Household Composition
Age
Household Deprivation
NS-SEC
Explore more demographic insights in this area
Go to Demographics tabPlanning
Planning Constraints
- Flood RiskPremium
- Ramsar Wetland SitesPremium
- Area of Outstanding Natural BeautyPremium
- Protected Nature ReservePremium
- Protected WoodlandPremium
- Crime RiskPremium