Area Overview for Croyland and Swanspool Ward
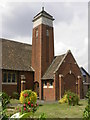
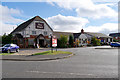
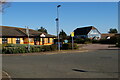
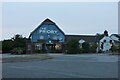
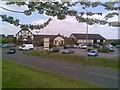
Photos of Croyland and Swanspool Ward

Area Information
Croyland and Swanspool Ward stands as a distinct electoral division within North Northamptonshire unitary authority in the East Midlands. This neighbourhoood spans an area of 4.4 km² and hosts a population of 14,477 residents. The location sits on the south side of Wellingborough, Northamptonshire, comprising five super output areas under a unified local government structure. Following boundary changes that took effect on 1 May 2025, the ward currently elects two councillors to represent the community. Historically documented since at least 2014, the area has evolved through various local government reorganisations to reach its current status. Daily life here is defined by its compact size and specific administrative boundaries within the broader North Northamptonshire council framework. Prospective homebuyers looking at this area find a zone where modern electoral boundaries merge with decades of historical documentation. The ward offers a defined living space that balances local identity with the administrative needs of the East Midlands region. Understanding this specific context is essential for anyone considering the practicalities of moving to this part of North Northamptonshire.
- Area Type
- District Borough Unitary Ward
- Area Size
- 4.4 km²
- Population
- Not available
- Population Density
- Not available
Demographics
The community profile of Croyland and Swanspool Ward reflects a mature and established population base. Official data identifies the median age as 70, indicating a significant proportion of senior residents live here. While specific figures for individual age ranges beyond the median are not detailed, the area clearly serves as a home for older generations. House ownership is prevalent, with 51% of residents owning their homes outright or with a mortgage. This high level of ownership suggests a stable, settled community where many families have long-term ties to the local area. The ward encompasses diverse household compositions and accommodation types, though exact breakdowns for these categories are not provided in current statistics. Beyond demographic metrics, historical research from 2014 highlighted that deprivation was a defining characteristic of the area at that time. Specifically, 63% of households were recorded as deprived across at least one Index of Multiple Deprivation domain, a figure significantly higher than the borough average of 34% and the national average of 42%. Multiple super output areas within the ward ranked among the 20% most deprived in England regarding employment, education, health, housing, and crime. This historical context remains relevant for anyone assessing the socioeconomic environment of living in this specific ward.
Household Size
Accommodation Type
Tenure
Ethnic Group
Religion
Household Composition
Age
Household Deprivation
NS-SEC
Explore more demographic insights in this area
Go to Demographics tabPlanning
Planning Constraints
- Flood RiskPremium
- Ramsar Wetland SitesPremium
- Area of Outstanding Natural BeautyPremium
- Protected Nature ReservePremium
- Protected WoodlandPremium