Area Overview for Burton and Broughton Ward
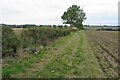
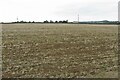
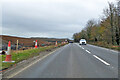
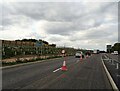
Photos of Burton and Broughton Ward
Area Information
Burton and Broughton Ward sits within North Northamptonshire in the East Midlands, forming part of the Kettering parliamentary constituency. This electoral ward covers 29.2 km² and holds a population of 2,068 residents. Living in Burton and Broughton Ward means managing a community that balances rural tranquility with administrative connectivity as a county council electoral division. The location sits at coordinates 52.365720894165044, -0.7216629858839526, placing it within a specific geographic context for local governance. You will find this area functions as a distinct unit within the wider administrative structure of England. The density of 71 people per square kilometre suggests a spread-out community rather than a dense urban settlement. Homes in Burton and Broughton Ward offer residents a living environment defined by these clear boundaries and historical electoral lines. Daily life here is shaped by the ward's role as a division for both local and national representation. Whether you are involved in local council affairs or participating in parliamentary elections, your connection to this ward is formalised through the Kettering constituency. The area's size and population count provide a stable foundation for understanding where services are delivered and how resources are allocated.
- Area Type
- District Borough Unitary Ward
- Area Size
- 29.2 km²
- Population
- 2068
- Population Density
- 71 people/km²
Demographics
The community profile within Burton and Broughton Ward reflects a distinct older demographic. The median age stands at 70, indicating that longevity is a defining characteristic of who lives here. While the dataset categorises age data broadly as "Age: Total", the high median age confirms a retirement-centric population structure. You should expect to meet primarily older residents who have likely called this area home for decades. Home ownership rates reach 72 per cent, which places this ward well above the national average for private tenure. This high level of ownership suggests a settled community with many longstanding residents. When you look at household composition and accommodation types, the data indicates these figures cover totals for the ward, reinforcing the stability of the housing stock. The absence of specific breakdowns for ethnicity or religion in the provided records means the demographic landscape is defined principally by age and tenure. Deprivation data is not included in the current compilation, so financial inequality cannot be quantified from this dataset. However, the high ownership percentage often correlates with household stability. Older residents typically have different needs regarding local amenities and healthcare access compared to younger families. Understanding that 72 per cent of households own their properties gives you a clear picture of the financial commitment residents have made to this ward.
Household Size
Accommodation Type
Tenure
Ethnic Group
Religion
Household Composition
Age
Household Deprivation
NS-SEC
Explore more demographic insights in this area
Go to Demographics tabPlanning
Planning Constraints
- Flood RiskPremium
- Ramsar Wetland SitesPremium
- Area of Outstanding Natural BeautyPremium
- Protected Nature ReservePremium
- Protected WoodlandPremium
- Crime RiskPremium