Area Overview for Bestwood Ward
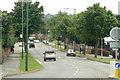
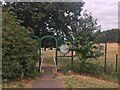
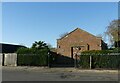
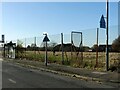
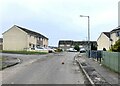
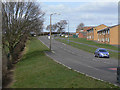
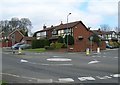
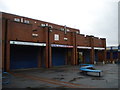
Photos of Bestwood Ward
Area Information
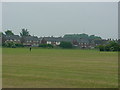
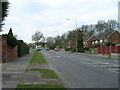
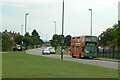
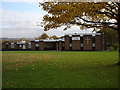
Living in Bestwood Ward offers a compact, village-like experience within Nottingham. This district borough unitary ward covers just 2.9 square kilometres, which keeps the local community tightly knit and easily navigable. You will find that 3,101 people call this small area home, creating a dense social environment where neighbours often know one another. The high population density of 1,052 people per square kilometre suggests that daily interactions are frequent and the local shops and services are likely within walking distance for most residents. Because the area is so small, daily life revolves around the immediate surroundings rather than long commutes into larger urban centres. The sense of place is defined by this concentrated population, meaning you are immersed in the local rhythm of the ward. There is no ambiguity about the scale of this community; it is a self-contained unit where local events and news travel quickly. For someone seeking a specific, defined neighbourhood rather than a vast urban sprawl, Bestwood Ward provides a clear and manageable setting. The physical boundaries are tight, which fosters a strong connection between the residents and the land they inhabit. You will not deal with the sprawl of larger cities here. Instead, you experience a focused living situation where the community size supports a close-knit lifestyle without the overwhelming scale of a major metropolis.
- Area Type
- District Borough Unitary Ward
- Area Size
- 2.9 km²
- Population
- 3101
- Population Density
- 1052 people/km²
Demographics
The community profile of Bestwood Ward reveals an older demographic compared to the national average. Residents here have a median age of 70, indicating that the area attracts mature buyers and older families rather than young professionals or students. This age profile means the neighbourhood is likely quieter during weekdays and sees different patterns of social activity than older, mixed-age districts. Home ownership stands at 45%, which suggests a balanced market where nearly half the households own their homes outright or through a mortgage. This level of ownership implies stability, as owner-occupiers tend to stay in their properties longer and invest in local improvements. The remaining 55% of households are likely renter-occupied, meaning there is a healthy rental sector available for those not ready to buy or needing temporary accommodation. Data does not break down specific household compositions by family size or single-person households, but the high proportion of elderly residents typically correlates with smaller household sizes. Ethno-religious diversity is not detailed in the available records, so the area may appear culturally homogeneous based on typical older settlement patterns. Regardless of the specific breakdown, the demographic data confirms a mature population structure. The age of 70 years is the single most defining statistic for who lives here. This leads to a community focused on retirement living, quiet neighbourhoods, and services suited to older adults.
Household Size
Accommodation Type
Tenure
Ethnic Group
Religion
Household Composition
Age
Household Deprivation
NS-SEC
Explore more demographic insights in this area
Go to Demographics tabPlanning
Planning Constraints
- Flood RiskPremium
- Ramsar Wetland SitesPremium
- Area of Outstanding Natural BeautyPremium
- Protected Nature ReservePremium
- Protected WoodlandPremium
- Crime RiskPremium