Building
Built before 1918.
Mixed Use Building
This is not a sales listing. Propbar data is compiled for informational purposes.
Daily Air Quality Index
1 / 10
Low band (1–3)
AQMA
Outside
No AQMA nearby
CAZ / ULEZ
Outside
No daily charges apply
Nearest A-road
246m
U · Moderate traffic risk
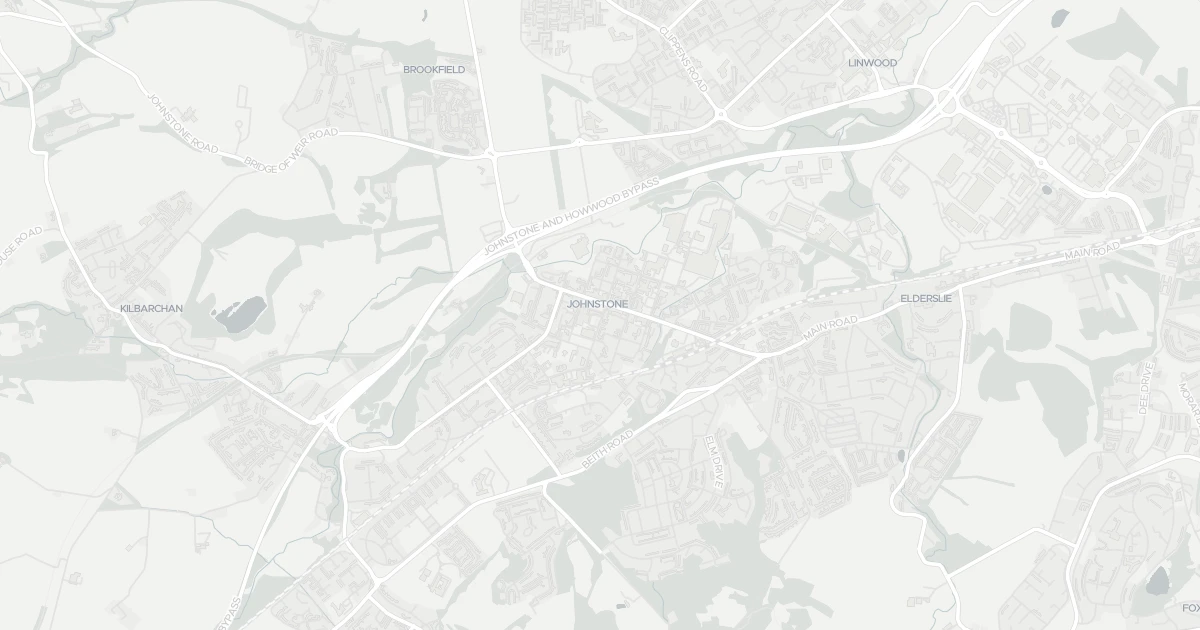
Use the interactive map to see how AQMAs, Clean Air Zones and pollution layers sit relative to the property.
Every measured pollutant sits comfortably below both the UK legal limit and the WHO guideline.
Each reading is the average amount of that pollutant in the air, in micrograms per cubic metre (µg/m³). For every pollutant, lower is better.
PM2.5 · Fine Particulate Matter
StableTiny particles (under 2.5 microns) from traffic, dust and burning, fine enough to reach deep into the lungs. The most harmful particle pollutant.
The dot shows this property’s reading. The two lines mark the WHO health target and the UK legal limit. Further left is cleaner air. Scale only, not a limit.
Well within both UK and WHO safe limits. (77% below the UK legal limit)
PM10 · Coarse Particulate Matter
StableLarger particles (up to 10 microns) from dust, construction and road wear that irritate the airways.
Well within both UK and WHO safe limits. (80% below the UK legal limit)
NO₂ · Nitrogen Dioxide
StableMostly from vehicle exhaust and combustion.
Well within both UK and WHO safe limits. (85% below the UK legal limit)
O₃ · Ozone
Ground-level ozone, formed in sunlight from traffic pollution.
Well within both UK and WHO safe limits. (100% below the UK legal limit)
SO₂ · Sulphur Dioxide
From burning fossil fuels in industry and heating.
Well within both UK and WHO safe limits. (95% below the UK legal limit)
Note: World Health Organization guidelines are stricter than UK legal limits. The UK's PM2.5 target is 10 µg/m³ by 2040, while WHO recommends 5 µg/m³.
No AQMA or Clean Air Zone applies to this property.
Air Quality Management Area (AQMA)
Not in an AQMA
This property is not in an Air Quality Management Area.
Clean Air Zone (CAZ) / ULEZ
Not in a CAZ or ULEZ
This property is not in a Clean Air Zone or ULEZ.
Roads nearby have a moderate impact on air quality at this property.
Nearest A-road
246m
U
Nearest motorway
4.8km
M8
Risk level
Moderate
Daily traffic
~496
vehicles a day
Around 150–300m of a busy road.
Modelled air pollution sits at moderate levels. Most people are fine, but sensitive groups may want to pay attention on worse days.
Across the UK, long-term exposure to air pollution is linked to an estimated 28,000 to 36,000 deaths a year. This is a national figure for context. It does not describe this property. Source: COMEAP
Air quality may have only a minor impact on this property's value.
Air quality can influence what buyers will pay and how quickly a home sells, but the effect varies street by street and is hard to isolate. Treat any value impact shown here as a guide, not a valuation.
These are modelled background estimates for the surrounding area, not live readings at this exact address. Levels can vary street to street.Source: Defra PCM · NAEI · Defra AQMA · Nearest station: Dumbarton Roadside (Urban Traffic, 12.4km away) · Updated 19 May 2026. Check on UK-AIR
A flat at Flat 2/1, PA5 8DS. It offers around 78 m² of floor space. The property holds an EPC rating of D and dates from before 1918. Nearby shops include Iceland Johnstone, Lidl Johnstone, Morrisons Johnstone and Aldi Patons Mill RP, the closest about 147 m away. The nearest stations are Johnstone Railway Station, Milliken Park Railway Station and Howwood Railway Station, around 522 m away.
Last Asking Price
—
Not currently listed
Propbar's Valuation Beta
£XXX
Range £XXX – £XXX
Price position
Price per sq ft
£XXX
Based on 840 ft²
Last Sold
—
No record
Market Timeline
—
Not currently listed
Times Listed
—
No history
Last Asking Rent
—
Not currently listed
Propbar's Valuation Beta
£XXX pcm
Range £XXX – £XXX pcm
Rent position
Gross Yield
X.X%
Annual return rate
Last Let
—
No record
Days on Market
—
Not currently listed
Times Listed
—
No history
1 of 12sections reviewed
Built before 1918.
We don't hold an HM Land Registry title on record for this address. This is common for leasehold flats, new builds and unregistered land.
No market history recorded for this property.
Sold prices, sales volumes and market pace for PA5 over the last 24 months.
Nothing on record for this property. See what's being applied for and built around it.
Outside the modelled flood-risk coverage (Scotland and Wales publish their own assessments).
What band D means for your bills, rental rules and upgrade headroom.
Crime data is only available for England and Wales, not Scotland.
Pollutant levels, the official index and health context for this address.
Prosperity data is not available for this property.
No school data is available for this property.
4 essentials within 15 min walk · 9 transport links nearby
We use cookies to provide you with the best experience. By continuing, you agree to our Cookie Policy .